API REFERENCE
API: Core
-
rvit.core.init_rvit.init_rvit(model_object, rvit_string=None, rvit_file=None, window_size=(900, 900))¶ Initializes rvit. This must be run for RVIT to do anything. Generally run immediately after the simulation/artifact has been instantiated. See GETTING STARTED!
- Parameters
rvit_file – a string containing the filename of an rvit GUI specification file
rvit_string – a string containing the rvit GUI specification
window_size – the (width,height) of the RVIT window
Either rvit_file or rvit_string must be provided. The former overrides the latter.
API: Visualizers
|
Displays a numpy array. |
The PointRenderer is used to display a scatter diagram of 2D points. |
The SpriteRenderer is used to display an image one or more times. |
takes a single scalar value data source and plots its recent history. |
takes a vector data source and plots its current state. |
-
class
rvit.core.vis.array_renderer.ArrayRenderer(*args, **kwargs)¶ Bases:
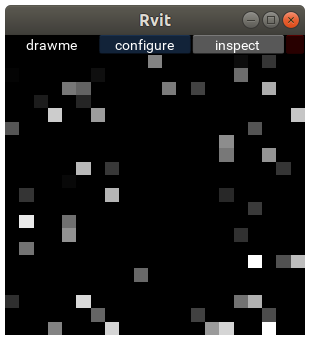
rvit.core.vis.components.xy_bounds,rvit.core.vis.components.color,rvit.core.vis.components.gradient,rvit.core.vis.array_renderer.array_dataDisplays a numpy array. The array must be 2 or 3 dimensional.
If the target array_data is 3D, then the 3rd axis can be of size 1, 3 or 4. The way the data is plotted depends upon this size of the 3rd axis in the following way:
If the 3rd Axis is of length..
1: the gradient component determines the color to be plotted.
3: the values in the array are the red, green and blue values to be plotted.
4: the values in the array are the red, green, blue and alpha values to be plotted.
Here is an example usage.
main.py¶from rvit.core import init_rvit from kivy.clock import Clock import numpy as np class Model(object): def __init__(self, *args, **kwargs): l,h = -0.5,0.5 r = 21 depth = 1 self.y = np.random.rand(r,r,depth) # the array to display ## iteratively update the array def iterate(arg): self.y[:] = np.random.randn(r,r,depth) ## start a thread to call the iterate fn as ## frequently as possible Clock.schedule_interval(iterate,0.0) init_rvit(self,rvit_file='rvit.kv',window_size=(300,300)) ## <-- Starts RVIT if __name__ == '__main__': model = Model()
rvit.kv¶#:kivy 1.0 #:import ArrayRenderer rvit.core.vis.array_renderer FloatLayout: ArrayRenderer: # A Visualizer array_data: 'y[:,:,:]' # a DataSource array_data_preprocess: 'lambda x: np.log(x)' xmin: 0.0 xmax: 1.0 ymin: 0.0 ymax: 1.0 pos_hint: {'x':0., 'y':0.} # parameter (from Kivy Widget) size_hint: (1.0,1.0) # parameter (from Kivy Widget) unique_name: 'drawme' # a unique identifier for this visualizer
minimal example
-
on_touch_down(touch)¶ Receive a touch down event.
- Parameters
- touch:
MotionEventclass Touch received. The touch is in parent coordinates. See
relativelayoutfor a discussion on coordinate systems.
- touch:
- Returns
bool If True, the dispatching of the touch event will stop. If False, the event will continue to be dispatched to the rest of the widget tree.
-
on_touch_move(touch)¶ Receive a touch move event. The touch is in parent coordinates.
See
on_touch_down()for more information.
-
-
class
rvit.core.vis.point_renderer.PointRenderer(*args, **kwargs)¶ Bases:
rvit.core.vis.simple_renderer.SimpleRenderer,rvit.core.vis.components.xy_bounds,rvit.core.vis.components.color,rvit.core.vis.data_sources.x_data,rvit.core.vis.data_sources.y_data,rvit.core.vis.data_sources.color1d_data,rvit.core.vis.data_sources.size_dataThe PointRenderer is used to display a scatter diagram of 2D points.
It can use a
color1d_datato determine the color or size of the displayed points andsize_datato determine their size.
A PointRenderer showing 50,000 points. A SecondaryDataSource is being used to color the points by their position within a grid.
The rvit configuration file used to make the figure image is the following:
PointRenderer:
     pos_hint: {'x':0.0, 'y':0.0}
     size_hint:  (1.0,1.0)
     target_object: model
     x_data: 'chemistry.pos[:,0]'
     y_data: 'chemistry.pos[:,1]'
     color_data: 'chemistry.zone'
     size_data: 'chemistry.pos[:,0]'
     show_controls: True
     point_size: 0.5
     xmin: 0
     ymin: 0
     xmax: 1
     ymax: 1
     color: [1.0,1.0,1.0,0.8]
     unique_name: 'pos'
-
point_size¶ a float :: when the size_data parameter is not provided, this property specifies the color for all plotted points. When color_data is provided, the alpha value is still used.
-
-
class
rvit.core.vis.sprite_renderer.SpriteRenderer(*args, **kwargs)¶ Bases:
rvit.core.vis.components.xy_bounds,rvit.core.vis.data_sources.x_data,rvit.core.vis.data_sources.y_data,rvit.core.vis.data_sources.rot_data,rvit.core.vis.data_sources.color1d_data,rvit.core.vis.data_sources.size_dataThe SpriteRenderer is used to display an image one or more times. It takes x,y and (optionally) rotation coordinates that specify the position of the image(s).
-
image¶ a string that specifies the path to the image file, e.g., ‘img/robot.png’
-
sprite_size¶ Specifies the size of the sprites.
-
-
class
rvit.core.vis.scalar_tracker.ScalarTracker(*args, **kwargs)¶ Bases:
rvit.core.vis.components.xy_bounds,rvit.core.vis.components.color,rvit.core.vis.components.gradienttakes a single scalar value data source and plots its recent history. Here is an example usage.
main.py¶from rvit.core import init_rvit from kivy.clock import Clock import numpy as np class Model(object): def __init__(self, *args, **kwargs): self.track_me = 0.0 ## iteratively update the positions of the particles def iterate(arg): self.track_me += np.random.randn() * 0.025 ## start a thread to call the iterate fn as ## frequently as possible Clock.schedule_interval(iterate,0.0) init_rvit(self,rvit_file='rvit.kv',window_size=(300,300)) ## <-- Starts RVIT if __name__ == '__main__': model = Model()
rvit.kv¶#:kivy 1.0 #:import ScalarTracker rvit.core.vis.scalar_tracker FloatLayout: ScalarTracker: pos_hint: {'x':0.0, 'y':0.0} size_hint: (1.0,1.0) y_scalar: 'track_me' ## variable to track and plot gradient: 'plasma' show_controls: True # fps: 100 unique_name: 'scalar_tracker'

minimal example
-
line_width¶ when fill is none this specifies the width of the drawn curve as a fraction of the visualizer’s height
-
num_samples¶ history length in samples
-
y_scalar¶ variable which is to be tracked
-
-
class
rvit.core.vis.vector_tracker.VectorTracker(*args, **kwargs)¶ Bases:
rvit.core.vis.components.xy_bounds,rvit.core.vis.components.color,rvit.core.vis.components.gradienttakes a vector data source and plots its current state. Here is an example usage.
main.py¶from rvit.core import init_rvit from kivy.clock import Clock import numpy as np class Model(object): def __init__(self, *args, **kwargs): N = 51 self.t = 0.0 self.track_me = np.zeros(N) ## iteratively update the positions of the particles def iterate(arg): self.track_me[:] = [np.sin(x*self.t) for x in np.linspace(0,1,N)] self.t+=0.05 ## start a thread to call the iterate fn as ## frequently as possible Clock.schedule_interval(iterate,0.0) init_rvit(self,rvit_file='rvit.kv',window_size=(300,300)) ## <-- Starts RVIT if __name__ == '__main__': model = Model()
rvit.kv¶#:kivy 1.0 #:import VectorTracker rvit.core.vis.vector_tracker FloatLayout: VectorTracker: pos_hint: {'x':0.0, 'y':0.0} size_hint: (1.0,1.0) y_vector: 'track_me' ## variable to track and plot gradient: 'plasma' vmin: -1.0 vmax: 1.0 fill: 'columns' column_gap: 0.5 show_controls: True unique_name: 'scalar_tracker'

minimal example
-
bar_thickness¶ when fill is bars this specifies the (vertical) thickness of the bars. Given as a percentage of the height of the visualizer
-
column_gap¶ when fill is columns or bars this specifies the gap between those drawn things. This is as a percentage of each column.
-
y_vector¶ variable which is to be tracked
-
API: Components
Provides a single 4-tuple parameter [R,G,B,A] that can be used to specify the the primary color of the visualizer. |
Provides four configurable parameters that determine the limits of a 2D display. |
-
class
rvit.core.vis.components.color(*args, **kwargs)¶ Provides a single 4-tuple parameter [R,G,B,A] that can be used to specify the the primary color of the visualizer. May be (partially) overridden by the color data sources…but in some cases (e.g. the color_1d data source) the alpha component still is used.
-
color¶ a 4-tuple ‘[red,green,blue,alpha]’ :: when the color_data parameter is not provided, this property specifies the color for all plotted points. When color_data is provided, the alpha value is still used.
-
-
class
rvit.core.vis.components.gradient(*args, **kwargs)
API: Data Sources
|
|
|
All Visualizers have the following properties. |
vector containing the colors of each plotted item. |
|
vector containing the way each datum is to be rotated (in radians) |
|
vector containing the sizes of each plotted item. |
|
vector containing the x-values of data to be plotted. |
|
vector containing the y-values of data to be plotted. |
-
class
rvit.core.vis.data_sources.color1d_data(*args, **kwargs)¶ vector containing the colors of each plotted item.
-
color1d_data¶ vector containing the colors of each plotted item.
-
color1d_data_preprocess¶ the preprocessor for color1d_data
-
-
class
rvit.core.vis.data_sources.rot_data(*args, **kwargs)¶ vector containing the way each datum is to be rotated (in radians)
-
rot_data¶ vector containing the way each datum is to be rotated (in radians)
-
rot_data_preprocess¶ the preprocessor for rot_data
-
-
class
rvit.core.vis.data_sources.size_data(*args, **kwargs)¶ vector containing the sizes of each plotted item.
-
size_data¶ vector containing the sizes of each plotted item.
-
size_data_preprocess¶ the preprocessor for size_data
-
API: Interactors
Specifies a button that when clicked calls a method of the simulation object. |
Specifies a button that when clicked calls a method of the simulation object.
A string that specifies a function (or method) that is called when this button is pressed.