GETTING STARTED
Installation
<<Insert instructions from github.>>
Requirements
Python 3.5 or later
On linux you need to install the apt packages xsel and xclip
sudo apt-get install xsel xclip
Basic Instructions
To augment your simulation with RVIT you must do the following things.
Tell your program to start RVIT
Write a RVIT GUI-specification file
STEP 1: Tell your program to start RVIT
The script below defines a simple model of particles moving around in a random
walk. The highlighted line with the call to init_rvit()
shows how rvit is started.
from rvit.core import init_rvit
from kivy.clock import Clock
import numpy as np

class DiffusionModel(object):
    def __init__(self, *args, **kwargs):
        N = 10**4
        self.pos = np.zeros((N, 2))

        ## iteratively update the positions of the particles
        def iterate(arg):
            self.pos[:] = self.pos+np.random.randn(N,2)*0.01
        ## start a thread to call the iterate fn as
        ## frequently as possible
        Clock.schedule_interval(iterate,0.0)

        init_rvit(self,rvit_file='rvit.kv') ## <-- Starts RVIT

if __name__ == '__main__':
    model = DiffusionModel()
    ## An alternative, equivalent way to start rvit...
    # init_rvit(model ,rvit_file='rvit.kv')
init_rvit() takes two arguments. The first tells
RVIT where it can find all of the data that it will visualize and modify. In
this example all of the data to be visualized is in the DiffusionModel object,
so we pass self. An equally good solution would be to create the model and
start rvit afterwards, as suggested by the final, commented-out line in the
example above. The second argument tells RVIT where it can find the
GUI-specification file. This is a file that you will write to specify which
visualization and interactive elements are to be displayed–see Step 2!
STEP 2: Write a RVIT GUI-specification file
The GUI-specification file tells RVIT what to display. Its contents might look something like this:
#:kivy 1.0
#:import PointRenderer rvit.core.vis.point_renderer

FloatLayout:
    PointRenderer: # A Visualizer
        x_data: 'pos[:,0]'         # a DataSource
        y_data: 'pos[:,1]'         # a DataSource
        pos_hint: {'x':0., 'y':0.} # parameter (from Kivy Widget)
        size_hint: (1.0,1.0)       # parameter (from Kivy Widget)
        point_size: 1.0            # parameter (from PointRenderer)
        color: [1.0,0.1,1.0,0.25]  # parameter (from PointRenderer's
                                   #            component `color`)
        unique_name: 'positions'   # a unique identifier for this visualizer
This is a minimal example and so it includes only a single visualizer – a PointRenderer, called `positions’ which draws a point indicating the position of all of the simulated particles. When the script from Step 1 is run, RVIT reads this GUI-specification file and creates a realtime visualization of the simulation that looks like this.
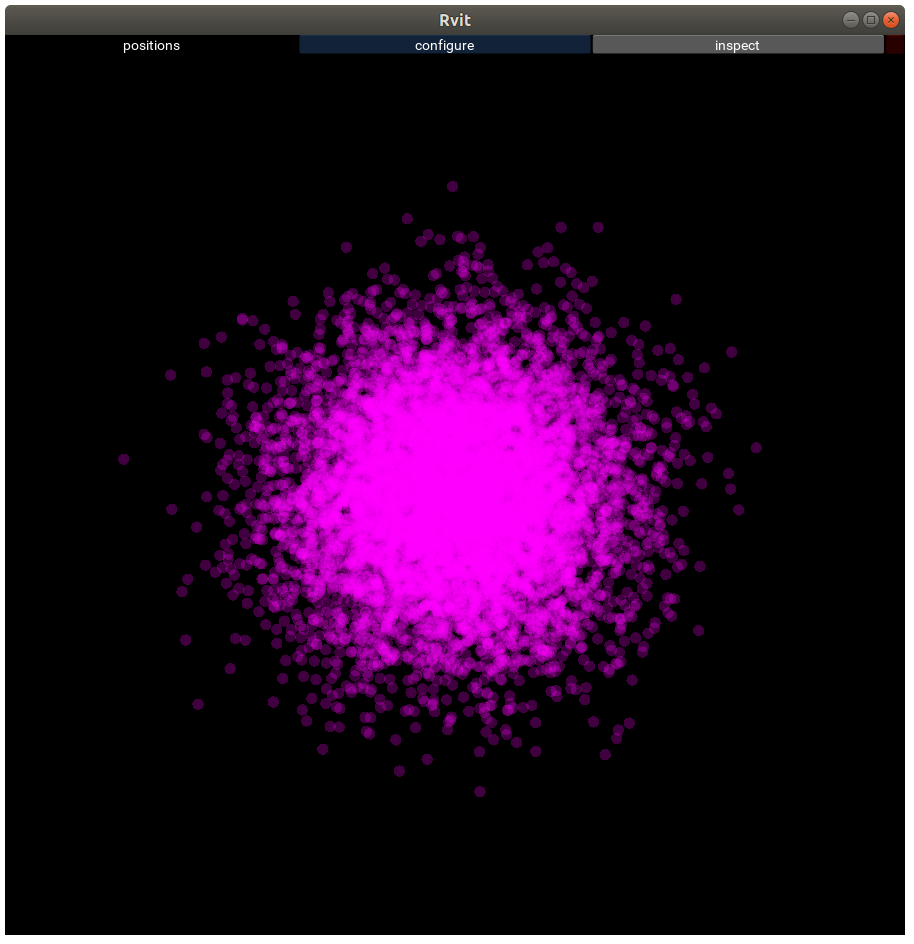
minimal example
The particles that all started at the origin have each followed a random walk, and now they are all distributed in the expected Gaussian distribution.
The GUI-specification file is hopefully pretty self-explanatory. Let’s look at each line.
FloatLayout:This is an essential line that allows the subsequent visualization and interaction units to be easily placed.PointRenderer:This is a visualizer i.e. a visualization component. Use the menu at the left to see what visualizers are available.x_data: 'pos[:,0]'this tells the visualizer where it can find the x-coordinates of the points that are to be plottedy_data: 'pos[:,1]'this tells the visualizer where it can find the y-coordinates of the points that are to be plottedpos_hint: {'x':0., 'y':0.}this specifies where the lower-left corner of the visualizer should be within the window, where 0,0 is the lower-left corner of the window and 1,1 is the upper-right corner.size_hint: (1.0,1.0)this specifies the size of the visualizer in terms of the entire window’s size—here saying that the PointRenderer should take up the entire windowpoint_size: 1.0this specifies the size of the points to be plotted. Larger numbers would make larger points.color: [1.0,0.0,1.0,0.25]this specifies the red, green, blue and alpha (transparency) of the points to be plotted. More complicated coloring schemes, where each point is given a different color are also available.unique_name:this specifies a unique identifier for this visualizer. Giving each visualizer a unique name allows RVIT to track changes made by the visualizatio end user, so that the changes are remembered inbetween executions of the model (sessions).
STEP 3. (optional) Modify GUI-component parameters from within the running program
<< TODO: Write some documentation on this. >>
A minimal example
If you want a base project to build from, you can install a quickstart project plus all the dependencies using cookiecutter.
You will need Python 3.5 or later first. If you do not already have this on your system, you can get it from [python.org](https://python.org), or by using your system’s package manager.
Next, install pip and virtualenv - you can do this through a package manager such as apt, emerge, or brew, if you have one. For example, with emerge:
bash sudo emerge --ask dev-python/pip virtualenv
Alternatively, there are complete instructions for installing virtualenv and pip here:
Create a virtualenv and install dependencies:
virtualenv env && source ./env/bin/activate && pip install cookiecutter
If you have already activated a virtualenv, and you need to reinstall a fresh virtualenv and example code, you can run this command instead:
bash deactivate && rm -rf rvit_example env && virtualenv env && \
    source ./env/bin/activate && pip install cookiecutter
Create, install, and run an example application:
bash cookiecutter -f --no-input gh:flaviusb/rvit-template && pip \
    install -U --upgrade-strategy eager -e rvit_example && rvit_example